L4 Buoy time-series
Real-time data from the autonomous buoys are telemetered ashore and displayed on the web. However, there is a limit amount of quality control that can be done on these data and they represent a tiny fraction of the data that is collected - typical daily files run to 1 - 2 Mb whereas the data telemetered ashore is only about 7 Kb. Indeed the data can be subject to errors in transmission and coding, as dropped characters cannot be easily accounted for. Therefore once the buoys are returned to shore for winter maintenance, the data loggers are downloaded and the entire dataset made available. The data are quality controlled by removing obviously spurious measurements and the nitrate sensor vicariously calibrated against in situ data.
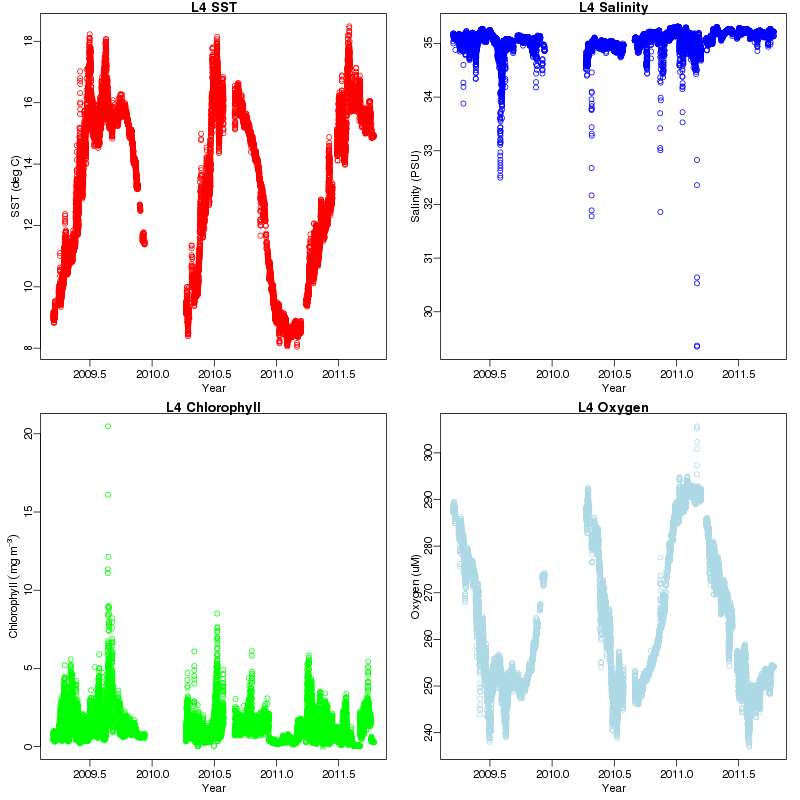
Below are shown sea-surface temperature, salinity, chlorophyll and oxygen data from the L4 buoy. There are now three, almost complete annual cycles available. The SST shows a variation of around 10 °C with a winter minimum of 8 °C and a summer maximum of around 18 °C. The onset of stratification, which lasts between April and October, is characterised by spikey jumps in temperature at the surface, as the surface layer is heated by varying degrees of solar insolation. The salinity series shows the clear effects of the Tamar estuary, with freshenings of up to 2 PSU during heavy rainfall and subsequent run-off events. There is tantalising evidence that these events drive short lived phytoplankton blooms, as shown in the chlorophyll data. The dissolved oxygen concentration is largely driven by temperature.
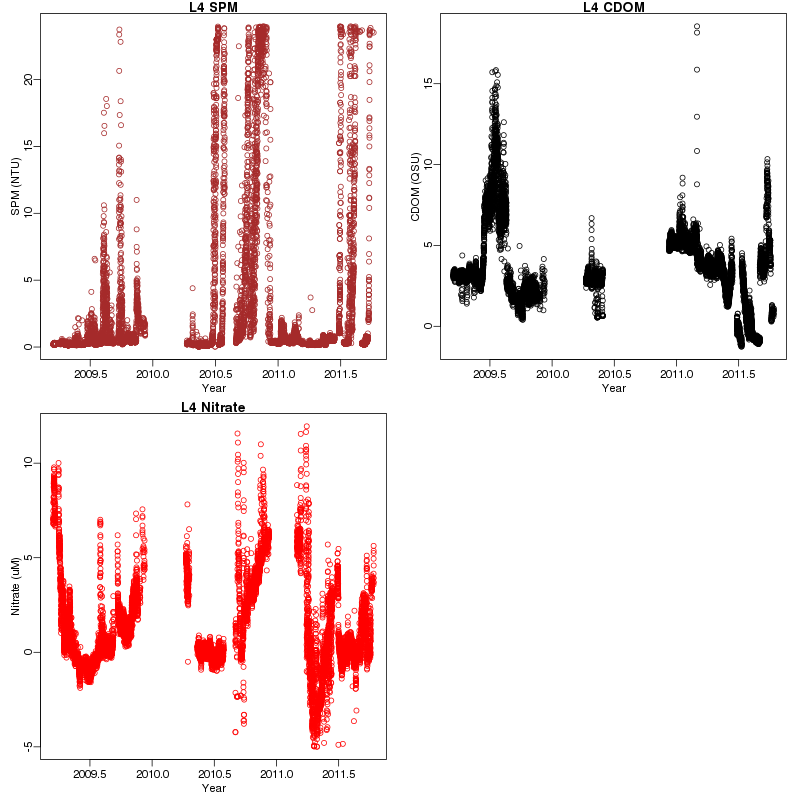
The L4 SPM signal is useable throughout 2009, and it can be seem that there are several peaks in the signal. This could be caused by several factors such as the detrital matter associated with phytoplankton blooms or the resuspension of sediment following a more windy period. Again, 2009 has produced the best data so far for CDOM with a summer peak in the signal, associated with an increase in the DOC pool from phytoplankton blooms. The data in 2011 is under investigation, and was difficult to reconstruct - it is likely there are some bio-fouling issues. The nitrate data has been compared with in situ boat collected data. The instrument is only accurate to 20% or 2 uM (which ever is worse!). The annual pattern of a winter maximum followed by an exhaustion of nutrients in the summer and a replenishment in the autumn can clearly be seen.
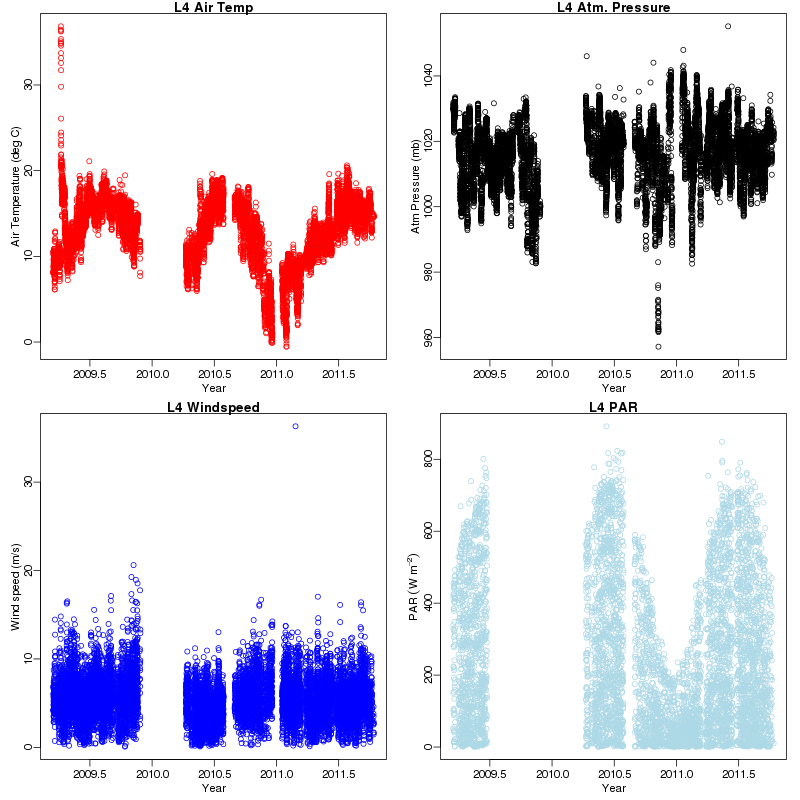
The meteorological parameters are shown only for completeness and give an idea of the range of the parameters and the annual cycle. The air temperature is strongly controlled by the sea-surface temperature, especially in the summer. The extreme cold of the 2010/11 winter can be seen. Unsurprisingly, atmospheric pressure varies between 1000 and 1020 mb, although an extreme low pressure in November 2010 is evident (960 mb). Windspeeds at L4 are generally around 0 - 10 ms-1 with some stonger 20 ms-1 at times. Maximum PAR in a day shows a clear envelope: winter values are around 200 Wm-2 whereas mid-summer values are a factor of four greater than this.
Click here to download the data.