L4 flow cytometry data
These plots show data generated using flow cytometry. Samples for flow cytometry have been collected at the WCO since 2007. The data can be downloaded from the Pangaea website as files for each year from 2007 – 2011 and from the BODC website from 2012. Once you are into either site, type "Tarran L4" into the search box to find out how to access the data. Flow cytometry involves using a laser-based machine to count particles and measure light that they scatter as well as fluoresce. A copy of the protocols can be downloaded here. Different groups of particles have different light scattering and fluorescence properties. This makes it possible for us to distinguish different groups of algae (phytoplankton) in live samples of seawater from L4 because the chlorophyll inside them fluoresces red when the laser beam shines on them. We can also count different groups of bacteria and tiny single celled zooplankton (heterotrophic nanoflagellates) by staining the same seawater samples with a dye that attaches to the DNA in the cells and fluoresces green when the laser beam shines on them. These measurements are taken every week by collecting seawater samples from 4 depths at station L4, bringing them back to the laboratory and then analysing them on the flow cytometer. We then have measurements of the plankton abundance as cells per millilitre of seawater through the water column which we use to see how their abundance changes with time as shown in the example plots below.
2023
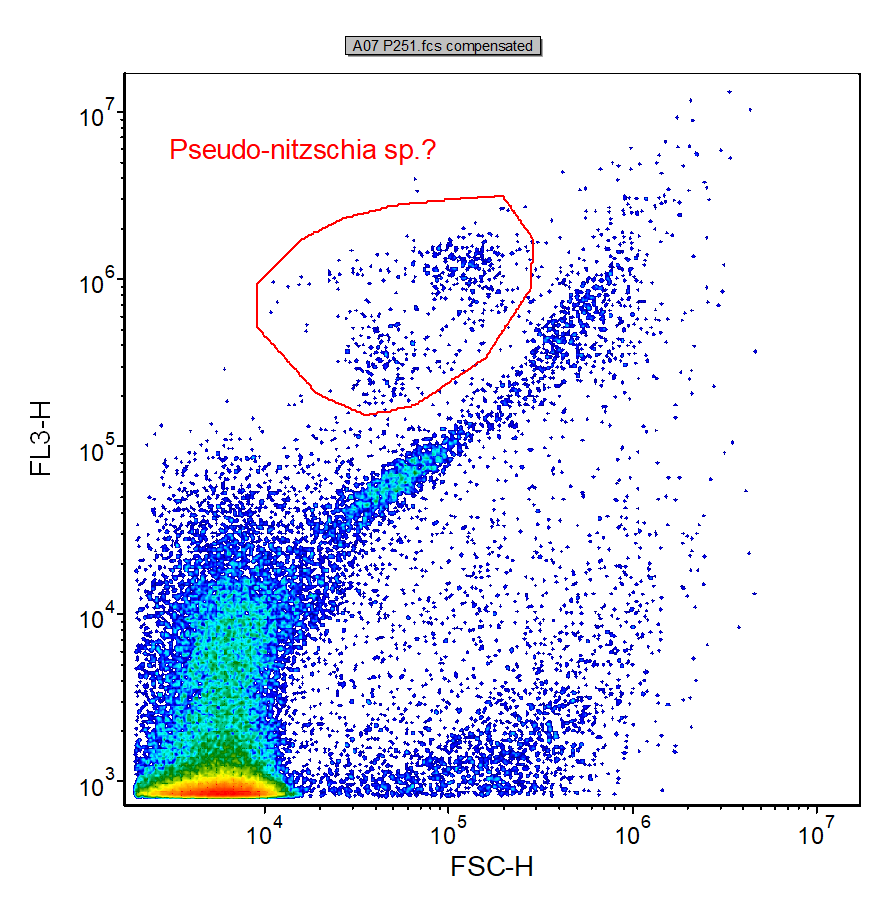
During 2023, the abundance of most groups of algae and bacteria were similar to long-term averages. The only group of note in 2023 was Pseudo-nitzschia sp. which reached an abundance of 2300 cells per mL in August at Station L4 (Figure A); 3-4 times higher than in previous years. There was no concurrent peak in Pseudo-nitzschia sp. abundance at Station E1.The identification of Pseudo-nitzschia sp. by flow cytometry is speculative. A cluster of events appears on a dot plot of forward light scatter vs chlorophyll fluorescence at times when Pseudo-nitzschia sp. is observed in plankton net samples. The cluster is characterised by having relatively low forward scatter signals compared to other algae (Figure B).
Figure A
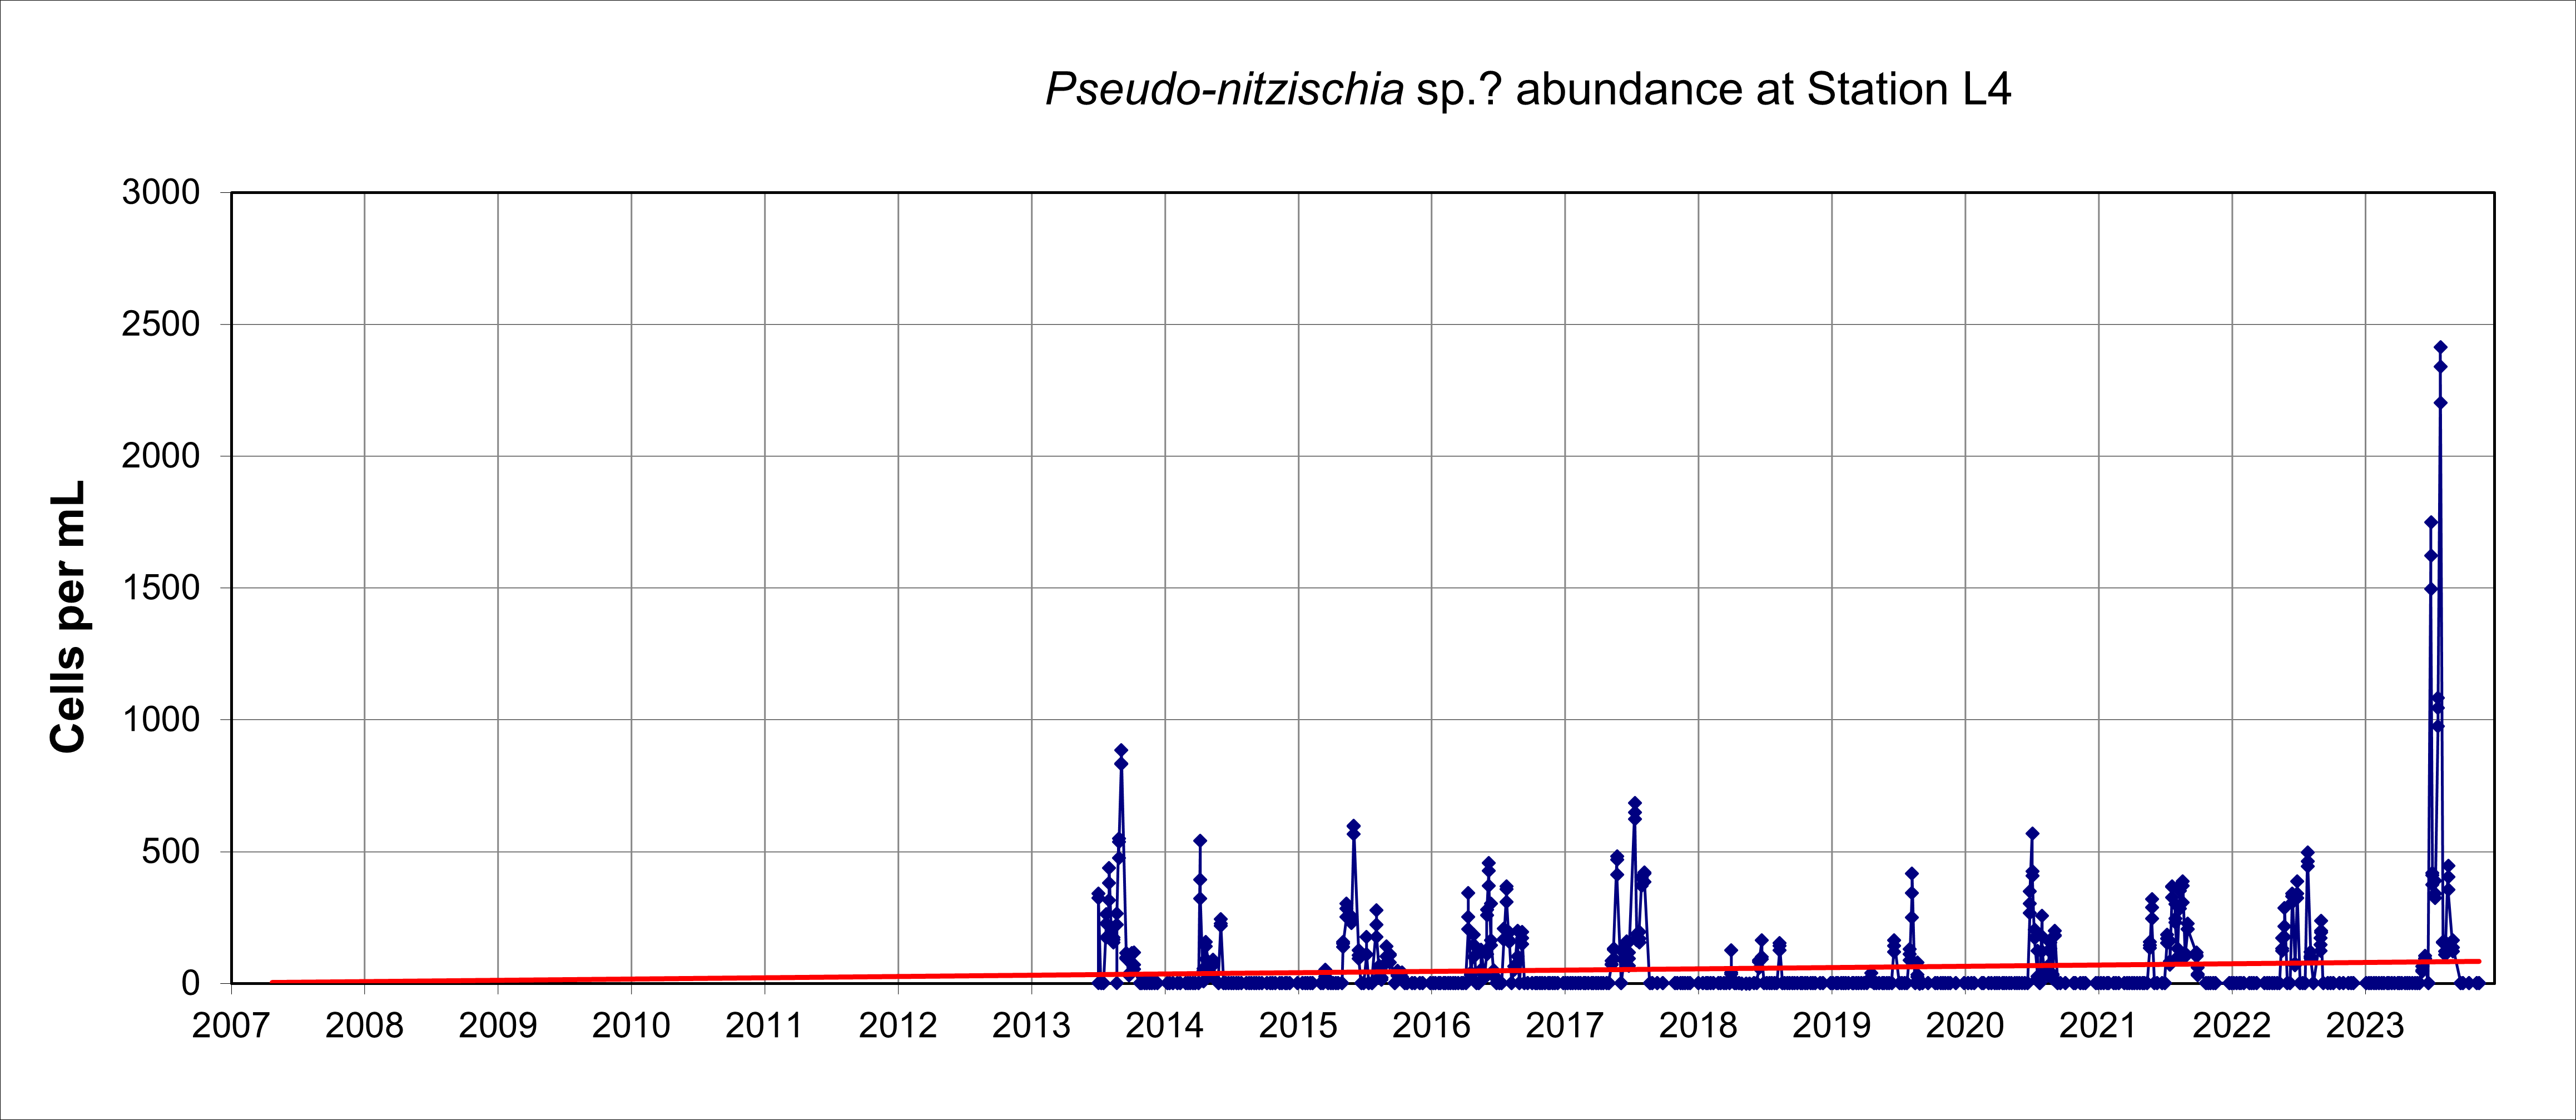
Figure B