L4 Chlorophyll - Turner fluorometer
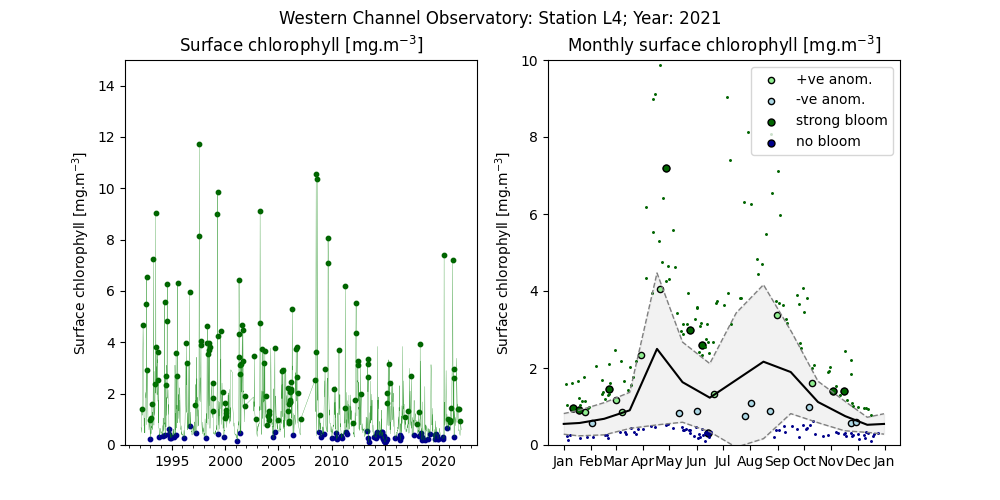
Chlorophyll concentration is determined by filtering 100ml of seawater through 25mm GF/F filters in triplicate and extracted in 90% acetone overnight at 4°C. They are analysed on a Turner fluorometer according to Welshmeyer (1994). The left hand plot shows the considerable annual and interannual variability in retrievals of surface chlorophyll at L4. On the right the monthly averages have been calculated together with the standard deviation (region in grey). The small dots, colour coded for maximum and minimum chlorophyll observed on a given day of the year outside the envelope of the standard deviation are shown and classified as strong bloom (dark green) and no bloom (dark blue). The latest available complete year data are shown in large symbols with positive anomalies shown in green and negative anomalies in blue. If outside of the standard deviation, the large symbols are coloured in dark blue or green. To obtain these data please contact Bethany Wilkinson (bwi@pml.ac.uk).