L4 pigment data
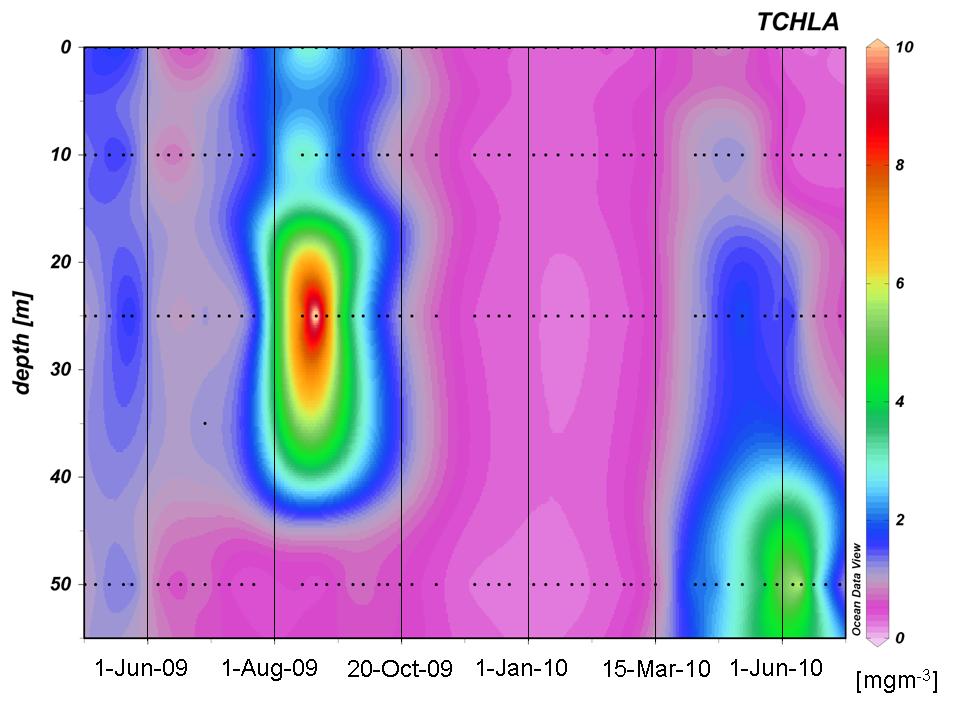
The contour plots show chlorophyll-a data generated using high performance liquid chromatography (HPLC) during 2009. The pigment data between 1998 - 2007 can be downloaded in its entirety. To use the complete dataset (1999 - 2010) please contact Ruth Airs (ruai-at-pml.ac.uk). HPLC involves using a light absorption measurement and the retention time in a column to separate and quantify the concentrations of different light absorbing molecules (pigments). Different groups of algae (phytoplankton) in samples of seawater from L4 can be identified because of their pigment combinations. These measurements are taken every week by collecting seawater samples from 4 depths at station L4, bringing them back to the laboratory and analysing them on the HPLC machine. We then have measurements of the phytoplankton abundance as milligrams of Chlorophyll-a per cubic meter of seawater through the water column which we use to see how their abundance changes with time as shown in the example plot below. In the plot, the green and orange/red colours show where the concentrations are highest.